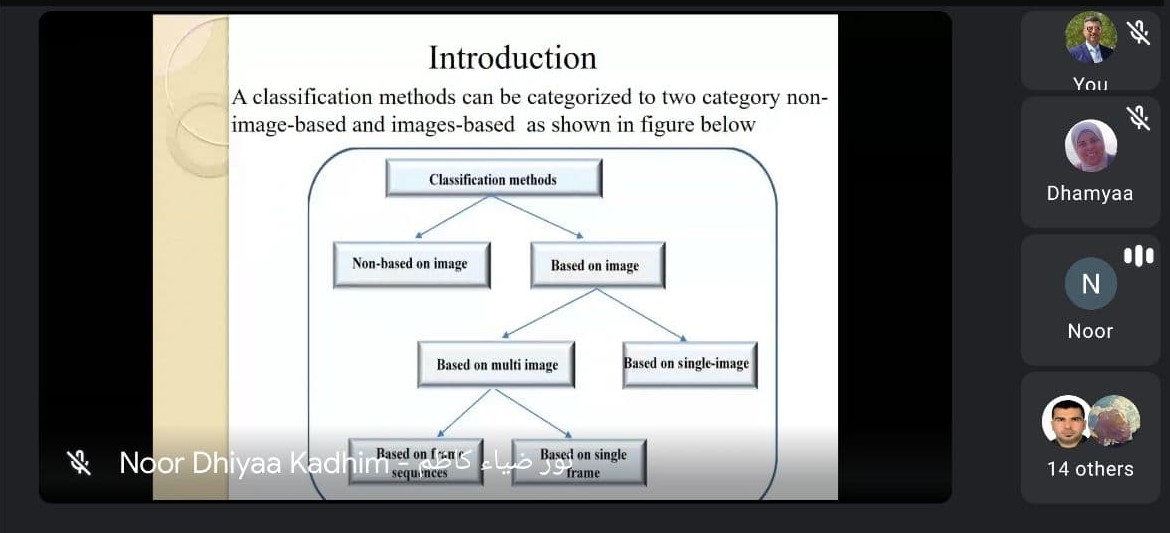
Asst. Prof. Dr. Nour Dhia’ Jawad, a tutor at the Computer Department / College of Computer Science and Information Technology, held a seminar on (DRIVER DROWSINESS DETECTION BASED ON SPATIO-TEMPORAL FEATURES WITH 3D CONVOLUTIONAL NEURAL NETWORKS). It deals with how to use, implement and monitor a person’s behaviour in a computer vision system in various control applications that provide human-computer interaction. The essence of these computer vision systems is based on extracting the various features of the human being and then tracking these feature maps over time series. Many video feature extraction methods depend on a single image and they extract the spatial feature relying on one frame at a time. But these methods lack efficiency because of their failure to use all the information provided by the video and the difference in lighting conditions over time. Besides, in most real-life scenarios, human expression changes spontaneously and in an emotionally inhomogeneous way that cannot be recognized in one frame. Methods based on multiple images extracted features and decision-making depending on time-series by analyzing image sequences (video frames that used the information available in the image sequence). In this paper, a spatio-temporal classification system is introduced to determine driver drowsiness relying on 3D deep neural networks (3D-CNN). It takes into consideration the temporal and spatial features, extracts the embedded features and tracks them along the time series during the proposed system. It can achieve better accuracy compared to 2D CNN. The proposed system was trained and tested using the “NTHU Drowsy Driver Detection (NTHU-DDD)” video dataset which presented five different scenarios for each subject. The proposed system can achieve accuracy up to 96% with the training group and up to 93% with the control group. Loss function values, on the other hand, reach 0.1206 for the training group and 0.2318 for the control group.